The Cornell Lab Bird Academy › Discussion Groups › Virtual Educator Retreat: Inspiring Investigations through Citizen Science › Virtual Educator Retreat: Data Literacy Through Citizen Science
-
Bird AcademyBird AcademyTake a few minutes to find a citizen-science project that will allow you to query the database. Answer the three questions in the discussion below.
- Which citizen-science project did your research? Provide a brief background.
- Is the database accessible to anyone? Could someone who has not participated in the project use the data? Can students access the information?
- How might your students use this citizen-science project data to conduct an investigation?
- The forum ‘Virtual Educator Retreat: Inspiring Investigations through Citizen Science’ is closed to new topics and replies.
-
I looked at Nature's Notebook https://www.usanpn.org/natures_notebook It is an easily-accessed citizen science project that measures changes in nature around you. With fall coming soon I think the Green Wave campaign would be an amazing citizen science project for the younger students at my school. This database is accessible to anyone and they provide a variety of campaigns. My students could look at data from previos years to determine if leaf color change is happening earlier or later than in previous years.
-
I researched GLOBE. It seemed to cover material for both biology and Earth science (different parts of the each course, but I like to use one site for both!). This project allows students to collect information about different spheres of the Earth and utilize this information as the class sees fit. The material is accessible by everybody, but if you want to contribute measurements, you must attend a training online or in person. Data is accessible by students or teachers. My students could use this data for our unit on climate change and examine how the environment has been changing.
-
I researched Monarch Watch, a non-profit organization based out of Kansas that utilizes the help of Citizen-Science volunteers from all over North America to help track and monitor the migration patterns of Monarch Butterflies. They collect data each year from all of the U.S., Canada and Mexico to help gain a better idea on the population status and the how their migration patterns might be impacted by human influences. The database is easily accessible on their website for anyone. It is collected data from years past that anyone can easily access and understand. The information is so detailed in providing location, time, date , description and more. This data would be perfect for my learners as we recently began to collect and monitor the local Monarch population this Summer. We would collect eggs of Milkweed, house them inside to raise them and release them as full grown butterflies. Moving forward, my learners can help contribute data to Monarch Watch as they easily provide a step-by-step process on how to properly collect data. My learners can also use the past collected data to make hypotheses on future migration and population patterns.
-
Russell, my school informally does this each year culminating in a Monarch Day. I would love to see my school doing this more formally.
-
-
I have always wanted to try to do Project FeederWatch in my classroom. I took this opportunity to look at the data that was available and was impressed by the number of participants and how that data was organized for you to review. The database was accessible to anyone and was easy to use. There was a map showing locations of feeders, information about specific bird species (where they were found, numbers seen together), and trend graphs that could be viewed for different species and even allowed you to make comparisons. Prior to doing any citizen science project I like to have my students spend time on the website to see how their data will be processed and what they are contributing to. I could see my students using this data to make predictions about what they think they will see on campus and then make comparisons afterwards to see if it aligns with other data or not. I would also like them to compare geographic locations as well as how populations of birds have changed over time in different parts of the country. When looking at the data I started to ask a lot of questions and I think the same thing could happen for my students, which would be a great start to the project and collecting our own data.
-
Many of the citizen-science projects, and using other's data in general, is a bit too advanced for early childhood (under age 6). I did look at Lost Ladybug as one of the participants below mentioned good charts, but it was still too complex. I do think we could encourage the use of apps such as Seek and Merlin to support teachers to collect data with their students as many EC teachers don't feel confident with science. I also liked the Graph Choice Chart from the previous article, again to support teacher understanding. I think a lot of our teachers use the same graphs they've used before, or seen other use, without much understanding of why we use those graphs. I think this could be a useful tool to help teachers better explain the purpose of the graphs they use to their students.
-
I took a look at Monarch Watch and Journey North because we raised monarchs last summer but didn’t do any tagging or data collection. I was curious to see what we could do in the future if we did it again. Monarch Watch – This site gives information about raising monarchs, getting tagging kits, how to properly identify and tag monarchs, how to collect and record data and how to upload data to the project. It looks like a fairly straightforward project. From my brief look at the website, there are some simple graphs under some blog entries using the previous year’s data. It looks like anyone can access the information and the tagging and data submission process seem pretty straightforward. There are also several other projects available to student-scientists: larval monitoring, monarch size and mass, monarch flight vectors, and hydrogen isotopes. Could be used by individuals, families, small groups or classrooms. Journey North - This project’s focus seems to be seasonal migration patterns for several different species of insects and birds – hummingbirds, monarchs, robins, loons, orioles to name a few – also earthworms and gray whales. It also collects data for first signs of spring, ice-out dates, leaf-out dates as well as locating pollinator patches. It relies on collecting data in the form of sighting dates and locations. It looks accessible to anyone. There is a whole section of the website devoted to maps showing the data being currently collected as well as data from previous seasons. You don’t have to be part of the project to access the maps. The maps would be great for classroom practice with data and maps even if you weren’t participating in the project. It would also offer a wide variety of simple data collection and recording practices for the classroom for birds as well as some other species.
-
I also chose Monarch Watch and felt it provided a lot of great information. The website wasn't the cleanest looking but it was still pretty easy to navigate. Their collected data from past seasons is very detailed and easily accessible that anyone can use it. My learners also began collecting and raising Monarchs this summer. I feel they could utilize Monarch Watch's collected data to form their own hypotheses and projects. They can also help contribute data as well.
-
-
Lost ladybug generated some nice pie graphs. Milky Way project had many nice images. This information seemed available to anyone. The ladybug graphs could be used for graph reading practice.
-
I have a lot of previous experience with eBird (multiple years) and more recently experience with iNaturalist. Lately as I have been working on my plant identification skills I have been using iNaturalist a lot. I use it to find the location of a plant I am interested in seeing and then go out into the field to see if I can track it down. eBird hotspots is great to get primed with what one might see at that location and I tend to use that if I am traveling and going on vacation. Both of these are available to anyone and with a little bit of time I am sure someone who has not participated in the past would be able to figure out. I would recommend to someone new that they should use a desktop web-based site when starting out which is a little more user friendly than the app versions in both instances. One of my favorite things in both cases is the maps. With eBird students would be able to see when sighting are and where during different parts of the year. They can then start to make connections between types of biomes in different areas or perhaps in the case of migration start to think about which locations are most vulnerable or are most important for conservation purposes. With iNaturalist I plan on having students build the database by contributing data and I would like to build a long term log of what is on the High School campus overtime so that we can monitor improvements to biodiversity through our native plantings initiatives.
-
1. Which citizen-science project did your research? Provide a brief background. - I researched Seek and iNaturalist. Since I work outdoors, these are the best tools to have while on the trail. Seek was created by iNaturalist and is more kid friendly. While these programs do not look at specific species or types of creatures, just by taking a picture of something (plant, animal, insect, fungus, etc), you can find out the local numbers of that species, the most common times during the year to see it, and how many have spotted recently. 2. Is the database accessible to anyone? Could someone who has not participated in the project use the data? Can students access the information? - The database is accessible to anyone. Both apps allow you to view all of the local activity and data that has been captured. Students can easily access data to learn more. 3. How might your students use this citizen-science project data to conduct an investigation? - These apps would be particularly helpful in conducting investigations about local populations and their yearly seasonal patterns.
-
I wanted to spend some more time working with the data in eBird since I really enjoyed learning about all of the resources it provides in the webinar. There is a lot of data and anyone can use it. I think this would be a great ongoing project throughout the school year so students can use their observations and data to study bird migrations. In the beginning, I think it would be cool to have the students design questions they want to explore and this can help them focus their research and investigation. I think this will help their observation skills and give them a better understanding of what is going on in their backyard.
-
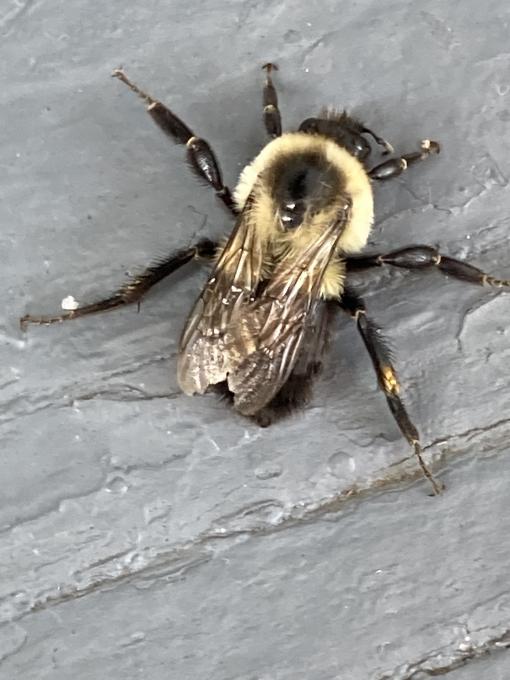
I chose Bumble Bee Watch because I have used it as an individual but not in a classroom setting. This project tracks and monitors bumble bee populations by having citizen scientists take pictures and identify different species of bumble bees. The information is then verified by an expert and added to the database. The database is accessible to anyone, including students, regardless of whether they participate in the project or not. There is an app, which is very easy to use, to identify a particular species of bumble bee. Since bumble bees are practically everywhere, students would be able to collect data. I think it would be interesting for students to learn how many different species of bumble bees exist. I know that I have learned a lot. I attached a picture of a common Eastern bumble bee. :)

-
What a fun project that can be done on the school grounds and at home! Great way to learn more about their local ecosystem.
-
I hadn't heard of this one! This seems like a really cool project.
-
How did I get this far in life and not truly know that there are different species of bumble bees! What a great sounding project that could lead into so many more investigations (agriculture!).
-
I'll add my agreement. This one sounds great for individuals, families and the classroom.
-
Oh wow! I need to check this out for myself! We are huge fans of bees in my family and this would be fun!
-
-
From looking at all the projects, I am excited to offer my students the choice of researching and questioning something that is interesting and relevant to our school. For instance, there is much geese droppings all over the baseball field. Is there something that can be done to change this condition? Some students, are interested in plants and how they interact so they can possibly follow up on questions about how plants share space or compete with other plants. I anticipate that the engineering of bird feeders will be of interest to my students so they can track how much they are used by the amount of seeds remain compared to what they initially start with. I am probably going to work with eBird. I will begin by having my students collect their own data and then compare it to similar datasets to see if their findings coincide with others.
-
I looked at GLOBE data visualization. I hope to start looking at climate data for our area. Between the GLOBE data and CoCoRaHS data, I would like to have my students see how our climate is changing over time. Plus we will start tracking data at our school. It looks like you need to have an account to access the data. Both are free accounts. Students can pick rainfall, snow, hail, etc and compare how it has changed over time. They can pick another city and compare their data to ours. Lots of different options.
-
Take a few minutes to find a citizen-science project that will allow you to query the database. Answer the three questions in the discussion below. I recently came across a citizen-science project, similar to eBird, but for butterflies, moths and caterpillars. It is called the Butterflies and Moths of North America (BAMONA) project. The project requires you to register, is free & open to the public. BAMONA uses quality-controlled data about butterflies and moths for the continent of North America (from Panama to Canada). Anyone (even those who aren't registered or have not participated in the project) can access the data. It would be very worthwhile to cross the data from the citizen science project examining light pollution (Globe at Night mentioned by Martha in an earlier post) with the data gleaned from here. A student can investigate whether light pollution affects moth individuals observed or even biodiversity.
-
That sounds like a great idea to look at moth data and light pollution to see how moth populations are affected by light pollution. I really enjoy watching moths and butterflies in the wild, and I have tried planting gardens to attract them. Unfortunately, I know that the night lights on our porches, the street lights, and all the other light pollution must negatively impact these creatures, but I would like to see the data.
-
This sounds like a very interesting project. I will definitely be looking into it.
-
-
I spent time researching eBird as teacher. I like that the data is accessible to view. Log in is required to download. With the young learners I have, we would be exploring the website together. I will create a log in for my classroom. The data that most interests me as an elementary teacher are the abundance maps. This will help them better understand why we don't always see the same birds every day. It will lead to gathering data on what birds are seen on campus.
-
I looked at Globe at Night about the amount of light in the night time sky. Data can be downloaded in a variety of formats or on maps. I like maps even though I teach science and try to build a geographic literacy component in to each unit in my environmental class for grades 11-12. Frequently we look at maps and where things are happening. The data can be accessed by anyone even without contributing. I think though, that I would want to have students collect data before accessing it (doing one without the other seems weird to me). This is one project that I think all of my students might be able to manage an observation for. Even those who play video games until all hours in the night/morning ought to be able to grab a few second to record an observation. The only issue would be that some of my students do not have a phone. I think there might be some work arounds for that though. If we are allowed field trips this year this would dovetail pretty nicely with our Space Discovery Center's Science on a Stick (think multiple projectors on a spinning sphere). They do have a cool video about light pollution. Side note: Also (a few years back) NOAA got ahold of some satellite data about lights at night (after the air force used whatever they wanted from the data set) and found out that the Sea of Japan, Nigeria, and Russia/Siberia seemed to have an awful lot of night light/pollution. Japan was traced to fishing. Nigeria was traced to oil drilling. And Russia had so much oil drilling going on that clearly they were lying about how many barrels they were getting/year. Not quite spy worthy, but still rather fun nonetheless that we have indirect ways of checking up on each other.
-
I really like this idea!
-
I really like the idea of possibly using this global approach in teaching about science and possible offering cross curricular instruction with other coursework. Maybe the environmental science, math and global classes could collaboratively work on a project.
-
This sounds very interesting, and I'm sure something some students (and adults!) have never thought about! I don't think I would have chosen those three areas of high night pollution!
-
This sounds fascinating. I'm going to have to check this one out. Thanks!
-
This is so cool!
-
-
1. Globe Observer Mosquito Habitat Photo Challenge (https://observer.globe.gove/mosquito-challenge) Participants are asked to take photos of natural or artificial mosquito habitats with or without larvae. In addition to the habitats, photos of the area surrounding the habitat are also to be taken and submitted. The photos are used to "create automated classification programs that can identify mosquito larvae and the environments they prefer." The information is used to assist in preventing outbreaks of mosquito-borne disease. 2. Although apps need to be downloaded to input information, the database is accessible to anyone and includes number and location of mosquito observations, and a breakdown of the types of photographs and observations. Depending on the type of restrictions that each school establishes, students should be able to access the information. 3. Students would be able to use this citizen-science project data to where and when mosquitoes are most prevalent. This could, in turn, lead to an investigation on prevalence of mosquito borne illnesses in those regions, use of preventative measures (determine success of certain measures), etc.
-
I took a look at eBird which allows you to collect data about birds that you see and also allows you to look at data collected by other. It was free to sign up and was able to use the data even though I have not submitted any bird data. Students would be able to access the data. I had fun looking at sightings near my home for turkey vultures. I narrowed the time to just this year. Students could look at the changes in time by comparing data from different years. I also looked up a place that I plan to travel to an was looking for hotspots and sightings for goldfinches. Students could also research some of the hotspot locations to see what about the environment makes them a good place to see birds (Montezuma Refuge is a great spot close to me!)
-
The citizen science project I researched was Budburst. Budburst has a few Climate and Phenology Projects. I was looking at the "Plants and Climate Change" Autumn Color Change Project. I do have an account however, the database is accessible to anyone. Students can access the information, but may need help in navigating how to download the data in a usable format. Students can download the data into CSV format and upload the CSV file into CODAP. Once in CODAP, students use the data to make various graphs that could answer some questions they have regarding plant growing season and climate change.
-
I like the concept of using the Budbust in conjunction with CODAP - definitely and interesting and informative tool for the students to be able to use!
-
@Bridget I'm going to check this out, seems really useful and can provide some insight to good inquiry lessons. Seeing a lot of good suggestions so far.
-
The Budburst project looks very interesting. I appreciate your information.
-
-
I spent time looking into the data for eBird. I have entered data into eBird in the past but I have never tried to download any of the data before. The raw data sets are overwhelmingly large and you need R software to manipulate the data properly. I think R is too advanced for even high school students so I am not how I can use this raw data with my students. I think that working with a smaller citizen science project that has smaller manageable data sets could be very beneficial to students. If the students could access the data from ebird their is an endless amount of questions they could ask using the data because there is so much data available. Someone that has not participated in the project can use the data and students could theoretically access the data but there are some barriers it seems to being able to use the raw data at student level rather than for a professional researcher/scientist. However, there is access to sighting data, maps and bar charts in formats that are easily available to students.
-
I researched Ebird. Ebird is a citizen science project managed by Cornell Lab of Ornithology. Through Ebird, registered users can document bird sightings and locations. This data can be accessed by registered Ebird users, regardless of whether or not they have made any observations. Since the project is free to use, it's data is *essentially* available to anyone. Students with a registered account could submit an access request as easily as their teacher could. Students could conceivably use this data to investigate how many of the birds commonly spotted in our geographic location are showing up at our feeders, to predict the best days to spot specific migratory birds in our area, or to analyze what factors may result in higher or lower counts than expected through data analysis (ie: perhaps our location by the train tracks or airport is to blame for lower concentrations of some birds that the data suggests)
-
Hi Stephanie, Does your school district allows students to share the emails out like this? I know ebird is fine, but my District has such issues with sharing emails out that I'm contemplating making a new ebird account for me the teacher and letting the kids from all classes upload their data that way. Any suggestions from anyone on this issue are more than welcome. Stinking problems like this keep more of us from using tech and citizen science.
-
-
I looked up eBird and GLOBE.gov. Global Learning and Observations to Benefit the Environment (GLOBE) allow an individual to do observations in four science investigation areas (biosphere, hydrosphere, pedosphere, and atmosphere), collect research grade data (through following set protocols) , and contribute to the database. Both projects allow public access to data sets even if the individual has not participated in the project. In eBird one can request access to data sets under Science | Use eBird Data and Tools. However, an individual need to at least create an account to be able to request for one. In GLOBE, one can retrieve a filtered data set(s) through the project's Advanced Data Access Tool (ADAT). No existing account is required to retrieve data sets. With real-world data sets available to the students (and STEM educators), educational training in the science practices will be more meaningful (knowing that the data were collected in the local setting). Moreover, as new data gets added to the data set through continuous participation in the project, the wealth of information that can be produced to answer scientific questions or investigations likewise increases.
-
My husband worked with the GLOBE project several years ago. We still have the kit in the basement...I might have to check that out!
-
GLOBE sounds quite interesting! It's good to know that data sets can be retrieved without an account. Thank you for sharing!
-
GLOBE is awesome! I was trained last week as an official Cloud observer. I plan to use some of their protocols in my classes this year.
-
GLOBE sounds really cool! I created a cloud research project when I was working on my Master's degree in science; so interesting!
-
-
I explored the Marine Debris Tracker. The goal of this citizen science project is to track litter in areas ranging from backyards to oceans. They are hoping to get a bigger picture look at plastic pollution and distribution. This University of Georgia project was initially developed through a partnership with NOAA and is now "powered" by Morgan Stanley, an investment banking/financial services company. Their database is accessible to anyone, with or without an account. I did a quick search exploring the amount of plastic logged within in the last 5 years. After the search concluded, I was given the option to download the data in an Excel spreadsheet. The website automatically created a pie chart and bar graph of the distribution by category and top items logged. An interactive map allowed me to zoom in on a particular area to see what specifically was logged there. I could see my students using the graphs created by the Marine Debris Tracker website to hone their skills on graph interpretation and identifying what type of graph is appropriate for different types of questions. Students could use the data to compare types of pollution in locations around the world. They could also ask questions about seasonal changes of debris tracked and investigate a possible relationship between the two.
-
That sounds interesting. Is it only Maine-specific? I wonder if there is something similar for the Great Lakes? Lake Erie is not doing so well. :(
-
@Stephanie Here is a link to the debris tracker. In the video they mention that everywhere is impacted by the water cycle- I think this would be a great way to connect a lot of science topics with a real life connection. https://debristracker.org
-
@Stephanie I was wondering the same thing! This would be cool to see with all U.S. Lakes and watersheds.
-
That sounds really interesting. I just heard about a robot "jellyfish" type thing with a net on the back of it being used in the harbor somewhere to clean up plastics and debris.
-
-
I was inspired by Kelly's presentation on eBird this week, so I took a closer look at eBird data. I wanted to know how many bird species travel through Arizona during migration. I know there are many that winter in Arizona, but I wanted to look for patterns that indicate they are only present in the spring and fall. I focused on Maricopa County, which is where our school is located. The data on the bar charts is accessible on eBird without an account, so my students would also be able to access this data. Because the data can be sorted by specific hotspots or counties, my students could compare and contrast numbers of species, migration patterns, and frequencies in those areas. Additionally, they could use the line graph feature Kelly showed us to compare a few species that are found here in Arizona. I would love to connect that with having students make their own observations and do their own data collection on our campus. It could potentially lead to other questions such as how we can attract and support more of the migrating birds that come through our area in the spring and fall. We could also compare that data with our Project Feederwatch data from the last few years. I did notice that the species maps on eBird are not accessible without an account, but that is something we could look at as a class if I sign in with my account. However, students can access the hotspot map to find which birding hotspots are near where we are.
-
I really enjoyed the eBird presentation, as well. It is so great that the students can access the data without an account to be able to compare and contrast and analyze the data.
-