The Cornell Lab Bird Academy › Discussion Groups › Inspiring Investigations through Citizen Science › Data Literacy Through Citizen Science
-
I researched the eBird site. It tracks citizen science sitings of birds to track where they are seen. There are many ways this data is sorted. Anyone has access to the eBird site, although to enter data, one must have an account. I could see students use this especially around bird migration. With data sets from around the world, eBird can show us where birds go and what distances they travel.
-
After reading a few posts from others, I chose to access iNaturalist and was very impressed! This is something my students and I can definitely use to explore more this spring, and is something they can do at home as well. I think this will be a resource they can use to explore various interest areas they have (specific animals and plants) and also develop questions that can drive future research. iNaturalist allows us to pinpoint in on a certain area of a map or to select certain species and access data about how frequently they are seen and in what numbers. I learned something new on the third animal I investigated...great blue herons, a favorite to spot at our house, are largely North American birds.
The data is accessible to anyone. I do not have an account with iNaturalist and I can see the data. My students could as well. I can also sign up for an account (and might just do so!) so that I can contribute to the wildlife sightings.
I think I would use this website to allow students to investigate the animal and plant life in our local area in order to develop an "I Wonder" board, followed by some time outside of school identifying plants and animals that we can see in the prairie, marsh, and wooded areas in our community, ultimately developing a research question that the students can turn into a hypothesis for the statewide science fair. They could either use the data they can find on iNaturalist or the data they collect. I considered investigating the native plant and animal life of Iowa this past fall, and with all the resources I am finding in this class, I am glad I saved that unit for this coming year! -
I selected eBird because we live in an area with so many birds. eBird is an online database where you can upload your bird findings anywhere in the world. This gives scientists information about types of birds, where they are found, and possibly migration patterns. For this website, you do have to create an account. It would be a little tricky for younger students to create their own account and log in, so I could either make an account for each of them or just make a class account and give them all the login information. Since we are studying birds and their habitats, this could be really useful to track the birds that students have observed in nature.
-
Thank you for sharing this information. This sounds similar to the website I investigated (iNaturalist) and it is good to hear that it sounds more cumbersome for students to use/create an account. This might be something I could log in to on the class ipad for them to use together.
-
-
I immediately thought about iNaturalist because data is available to anyone online. If you log in you can contribute data, but anyone can see data. Within iNaturalist are different 'projects'. Some projects are centered on specific kinds of animals in a certain area. My students and I might look at the biodiversity within a specific sub group in our state. For instance, we could look at the amount of different kinds of amphibians found in Missouri, as well as be able to make a pie chart of the percentages of the kinds found out of the total.
-
I selected Project Budburst.
This background was provided on the website:
"Budburst citizen scientists work together with research scientists, educators, and horticulturists to answer specific, timely, and critical ecological research questions by making careful observations of the timing of plant life cycle events, also called phenophases. These life events differ depending upon the type of plant, but usually include leafing, flowering, and fruiting phases of plants as well as leaf color and senescence." (09/19/20; cut from: https://budburst.org/aboutus)
the data base is available to anyone, including those who have not participated in the project.
My students adopted a Bigleaf Maple tress located on the school grounds to observe for the school year. The question they sought to answer was: How do trees respond to seasonal and climatic changes in their environment: temperature, length of day, and amount of moisture.
Log books were kept to record observations.
-
Ebird did the data research. We can use this data to see how many Ospreys occur in North Carolina and at what times of year. This gives us clues to migration patterns, and if we look at states like Florida, we can also compare numbers of Ospreys in summer and winter in NC with numbers of Ospreys in summer and winter in FL. Anyone can use the eBird data, including students. I think that students can start with birds in their own backyard or community and then use this data to explore how those same birds behave in other parts of the country.
-
Which citizen-science project did your research? Provide a brief background. I chose to use the https://www.cocorahs.org site because we will be putting up our first rain gauge at the school where I teach. Plus, it is a data collection tool that elementary and high school students can use. For those schools needing a low-cost tool to collect data, this is it. This is a citizen-science project with a global span.
Is the database accessible to anyone? Could someone who has not participated in the project use the data? Can students access the information? There are many avenues of data information. It seems to me that anyone can access the data.
How might your students use this citizen-science project data to conduct an investigation? I will be using this web project to help students both, do and use graphs. Plus, since it is a high school it is helpful to have "not boring" data collections. For example, "Use a graph to show the average rainfall, compared to the rainfall of Hurrican Dorian. Follow this by finding out how much damage to transport systems occured. Or how rapid do you predict the recovery of tropical forests?" -
I researched ebird from Cornell Lab of Ornithology. ebird's whole purpose is for anyone to be able to share their birding observations at any location in the world. The database is accessible to anyone who creates a free account. It is usable by anyone who has not participated in the project, but they would need to familiarize themselves a bit with the different ways data is expressed in ebird. Students can access information through an account. For my 4th grade students they would need some support with this. Ebird would be a useful way to explore data particular to our region, or to specific hot spots near our school. We could also look at migratory bird data over time to better understand patterns. If a student were interested in a particular bird in our regions, they could also use that as a focal point for data research.
-
I started exploring Project BudBurst earlier in this class so continued here. PBB is a phenology based observation tool. Participants choose a plant and can either do one time or lifecycle reports including species, location, date, and stage.
The database is accessible to anyone even if they've never submitted data. Students of all ages could easily access the data since there's no log-in required.
Students could use in a number of ways - each student could select a species to focus on and compare timing of lifecycle changes. Or all students could focus on a single widespread species and observe at different locations (e.g. near their house). -
Which citizen-science project did your research? Provide a brief background.
I did my research with Project Budburst. a national network of citizen scientists monitoring plants as the seasons change. When participating in BudBurst we watch for the key life events of a plant during the growing season. These events differ depending upon the type of plant but usually including leafing, flowering, and fruiting events. The study of these events is called phenology.
Is the database accessible to anyone? Could someone who has not participated in the project use the data? Can students access the information?
Budburst data is available for anyone to download and use. A budburst account is not required for data downloads. Students can access the data.
How might your students use this citizen-science project data to conduct an investigation?
With the pandemic going on and our school system deciding to continue online only instruction through at least February 1, 2021 using Groups would be a way to have students participate in a class project even though we are all at home. We could add to the data as well as research the data on BudBurst to create a meaningful class project. -
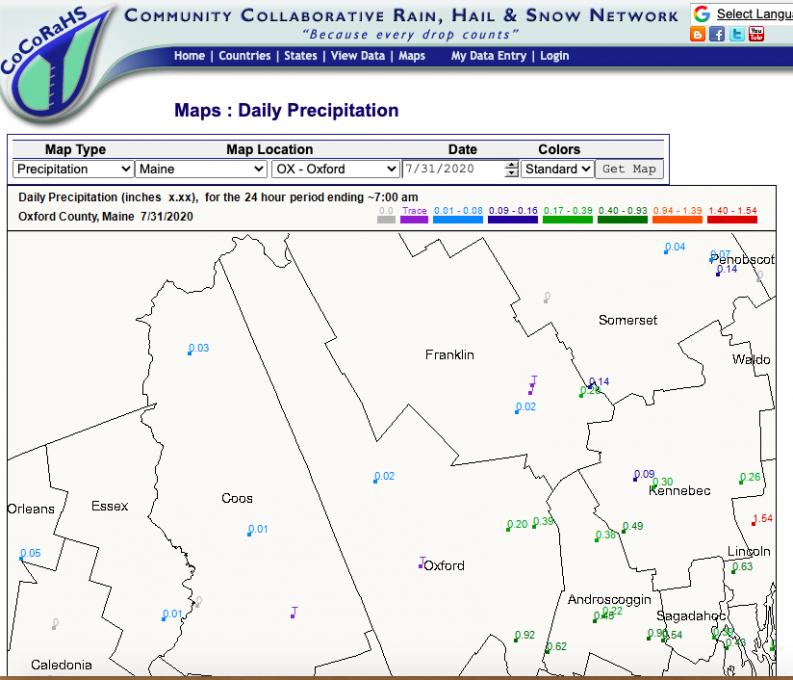
I am using the CoCoRaHS citizen science project for this discussion. The site, https://www.cocorahs.org has data available for anyone to use whether you are participating in the project or not. The Arizona library I worked at had a rain gauge which we monitored and entered daily precipitation entries. CoCoRaHS is an acronym for the Community Collaborative Rain, Hail and Snow Network. CoCoRaHS is a unique, non-profit, community-based network of volunteers of all ages and backgrounds working together to measure and map precipitation (rain, hail and snow). By using low-cost measurement tools, stressing training and education, and utilizing an interactive Web-site, our aim is to provide the highest quality data for natural resource, education and research applications. We are now in all fifty states.
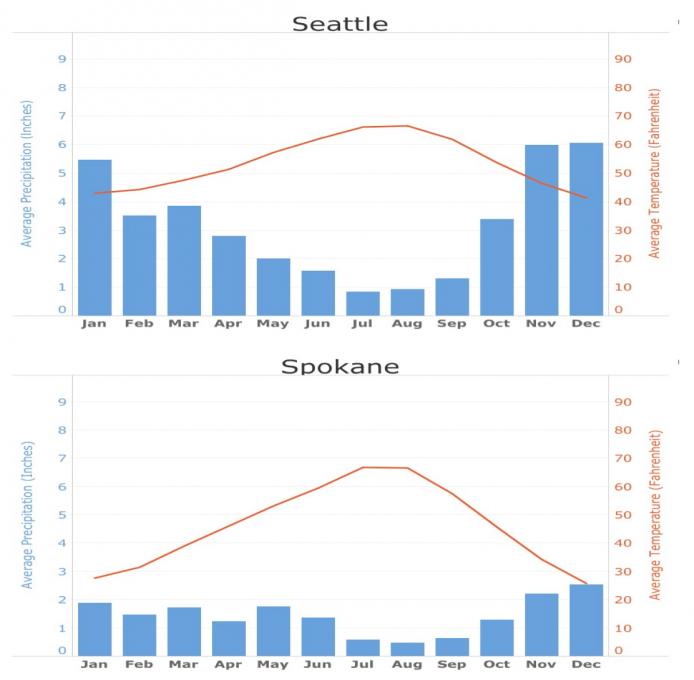
The data can be obtained at the top of the sites webpage, and has a lot of uses, especially with questions related to climate change. Users can get daily precipitation measurement readings in the U.S., Canada, and the Bahamas. The data can be drilled down to a single gauge by date or a date range.
I found the graphs below, Average Monthly Climate Data, especially interesting. The graph is both a line and a bar graph that gives me a quick view of categorizing rainfall amounts by month, and also showing a line graph of average temperature over time. Students could use this chart to get a summary of their area, and even compare the conditions of another large metro area. Data from gauges closer to their location could be plotted and compared. Depending on the location, data may be available as far back as 2010.

-
I usually turn to the iNaturalist database for any information I need, as they have data on every kingdom! iNaturalist data is accessible to anyone, even if you don't have an account. I think it would be a lot of fun to study data trends between different species, or even broader than that. For example, we can explore the relationship between the observations of pollinators and flowering plants, or something more specific like the observations of Monarchs versus milkweed plants. I think a large database like iNaturalist would provide the widest opportunities for students with any interests!
-
eBird has always been intriguing to me and it was lovely to spend a bit of time becoming familiar with all the various options. I found the website user friendly and the data "approachable" and well laid out. It appears as though anyone with an account can access the information with ease. All the species information was compiled in an easy to find format and the photographs are a phenomenal advantage. The addition of maps and bar charts helps with visualization and understanding of the data and it's processing.
-
I researched Journey North which is one of the largest citizen science programs in North America. This program tracks Monarch Butterflies, as well as birds, animals, and plant data. From what I can see, it looks like the database is accessible to anyone. I have not participated in the project for tracking Monarchs, but the lower school students at my school study them and have a weigh station in our garden. What I love about this resource is that it tracks the butterflies from January releasing a new "newsletter" each week to tell the story of the migration. There are interactive maps that show the migration in correlation to time and you can also look at the data using individual sighting. Either way, you can clearly see the journey of the monarchs north from Winter to summer. I think using this as a way to share the story with our students is wonderful and also to get them excited about tagging their own monarchs- I know they tag the ones that they bring inside, but beyond that, we don't have any exciting tagging parties that I know of... Monarch tagging and knowledge is not one that I know much of, but I would be interested in seeing how many of the teachers in lower school would be interested in using this resource more as a way to correlate the story of the Monarch to the data/map.
-
I could use iNaturalist to determine if the number of birds or insects are dependent on the temperature range during winter? Does a warmer winter effect the number of insects in the summer? This could clear up some of the general thoughts that people attribute to new species coming to their area.
The specific citizen science project I could also have the students participate in is the Bird Sleuth project from Cornell Lab. There is a ton of data to collect that can specific to the student’s backyard. -
I chose CoCoRaHS because I had tracked the weather with a student while working virtually this past school year. I think that it offers opportunities to follow the weather, to advance in number recognition and to possibly collaborate with other students from our school. CoCoRaHS is a citizen-science organization which just celebrated its 22nd anniversary. It started in Colorado after a significant rain event fell on one side of Fort Collins, and this caused flash flooding which killed 5 people. The Colorado Office of Community Management offered a grant to try to get students and families to track the weather to more accurately represent precipitation during the summer months. Three students from three separate high schools were among the initial group to work to record precipitation. Over the years, it has grown to include all 50 states.
What I found interesting is that anyone can choose a state and even a county and look at data from the present day or historically for as long as it has been measured in that state. You do not have to have an account to see the data, yet the sky is the limit for the questions a person could ask to observe weather patterns and events over the past 22 years. With this level of information, it seems that inquiry could include comparisons of different counties in Maine, or more regional comparisons. I am envisioning some way to create an interactive 'puzzle' which would be mounted somewhere on our playground to help learn the 16 counties of Maine. My hope is that we can get a weather station mounted somewhere near our playground so that the incoming students can observe the precipitation, record and report their findings. I am also thinking of ways to represent different types of graphs also mounted somewhere on the playground (perhaps in the woods along a trail) which would allow some outside applications of representing data for younger students. Some of the challenges will include making sure that it is consistently checked and working with other teachers to explore the data and ask the questions. -
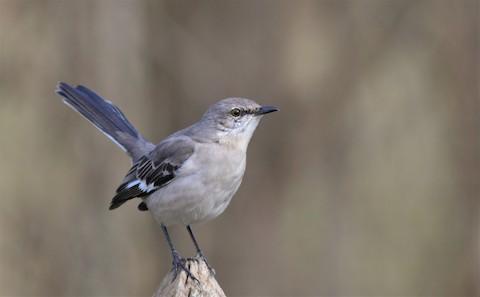
*The citizen-science project that I chose to research is e-Bird. Since I am investigating the Northern Mockingbird, I wanted to learn more about this singer. Using e-Bird, I found where the Northern Mockingbird was observed 22,503 times with 197 photos and 5 audio clips for West Virginia when I chose "all years."
This photo was on e-Bird. Credit given to Davette Sealer, Jane Lew, WV, US (3/4/2017)
"The difference isn’t always obvious, but songs are usually more complex and carry a clear pattern. Calls, on the other hand, tend to be shorter and simpler—often just one syllable long." Source: https://www.audubon.org/news/a-beginners-guide-common-bird-sounds-and-what-they-mean
I was able to look at the number of observations in the various counties in West Virginia, and discovered that Wood County where I live was ranked 5th in submitting information to e-Bird. It listed the observers by county and the number of species they identified.
*Anyone can access the data on e-Bird, and students could use the data with guidance. With the amount of information, I would provide a web quest that would guide students to the data that I want them to gather.
*I will use e-Bird to help students study the species of birds found on our playground. This website would be useful after some initial lessons introducing bird watching. Fourth graders can definitely use e-Bird with assistance.
-
- Project Budburst: It involves everyone from children to scientists, can experience all stages of an organism(s); it has several projects that anyone can do with others or individually.
- Anyone can access the database, felt the site is very user friendly (my 6-year-old daughter figured it out), you do not have to have any kind of subscription, fee, or account creation required which makes it nice for anyone to access the data.
- Younger students could partner or work collaboratively to select an organism to learn about and then teach the other students in class about their organism (would take some teacher guidance to ensure students do not pick the same organisms). Older students could use it more to see more of a data analysis style setting to where they pick a certain month or season timeframe they search and select 2-3 organisms and compare the results over a 3, 5, 10 year periods and see if there are any trends in how many of the organism observations there are. This project would also just help students in general with the ID of observations.
-
It sounds like Project Budburst is simplistic. I could use this to help identify plants already on our school playground. We have a garden, and would to install bird houses and bird baths. We could research the types of birds in our area, and what type of plants we need to plant to attract these birds. Once this is established, the younger grades could use Project Budburst and then go into e-Bird in the intermediate grades. Great idea with comparing the data over time periods. This would lend to students monitoring the plants while in the elementary grades at our school.
-
@Edna Edna, these are good points! At my schools we have nice courtyards which would be great ecosystems to study during the school year using Project BudBurst.
-
Doing this later than earlier had a benefit of reading other posts. I am very interested in doing more with Monarchs. We have been involved in the tagging and looking into that data-- with the teacher acct. (Younger students under 13 can not register for any of the sites to input data.)
This is a good sum from MV site... "data collected through the Monarch Larva Monitoring Project (MLMP) have provided valuable insight for monarch conservation habitat and population targets, including how many milkweed plants are needed to produce one migratory monarch. MLMP research (Nail et al., 2015) suggests the answer is 29 milkweeds! Other community science programs like Journey North and the Western Monarch Milkweed Mapper are painting a picture of where and when monarchs and milkweeds are found on the landscape.
How do these programs extend beyond monarchs? Monarchs are the draw, but humans are innately curious creatures. We cannot help but ask more questions or take note of the other things we see in our milkweed patch. Participating in monarch community science projects provides an opportunity to make observations, further connections in nature, and introduce volunteers to conservation work that benefits entire ecosystems."
Such a clearing house of info on that site-- It was ok-- for user friendly-- i would have to really work with students to explore site for answers.
Manipulating data on several sites-- I found out that where I liv does not have much data and it is not to interesting for students YET! I feel that maybe we can change that by making a data set for our area after we plant our pollinator and milkweed garden this year. -
I looked at EBird and learned a lot! Everyone can access it from the "Explore" tab, and it is really easy to look at the distribution of a specific species or see which birds were sighted in your area. The data is definitely usable, they actually produce a weekly bar chart for each species. I don't see a way to download raw data, but it might be possible if I contact the admins. I don't have students, but I can definitely create a program on bird migrations and include some data exploration before heading out on a trail to observe birds and see if what we find matches the data. We can also revisit the data after the hike (and upload our sightings) to see if anything stands out.
-
I researched Project Bud Burst, which is phenology and the study of the timing of life phases of all organisms. I like how the video used the description "plant storytelling."
The following paragraph in the site are questions our students are always curious about.
"How does a bear know when it's time to hibernate? Why do April showers bring May flowers? Plants and animals don't have calendars or watches, but many of them take cues from the changing seasons. Changes in weather with the seasons, such as temperature and precipitation, signal many organisms to enter new phases of their lives. For example, buds form on plants as temperatures warm in the spring. As temperatures cool in the fall, deciduous trees and shrubs lose their leaves and become dormant."
The database is accessible to anyone, and anyone can access the information, even without participation. Students can access the information. The younger children would have their teachers guide them and access it in small groups or whole class. The site is very organized and easy to access.
For my students I would use this project to conduct an investigation on our milkweed and when it blooms, when we discover our milkweed bugs, and our observations of butterflies.
-
I went through SciStarter and looked for CS projects that dealt with topics of Weather and Climate, since that is one major topic of exploration my sixth graders will be researching this year. I chose the Identify the Cloud project which asks students to identify unique clouds, either by using pictures already loaded onto the site or taking pictures of their own, loading them in, and then either identifying the cloud or waiting for others to identify the type. Unfortunately, I could not get the project site to load; it kept timing out. I did send a message to the project and am waiting for a response. As long as one has a SciStarter account, the project should be available to everyone. I could see my students using this project as a way to start identifying clouds by site as well as a way to tie clouds and weather together. Since I couldn't really get into the project to intensively research, I can't make a more thorough determination of how my students would conduct an investigation. Hopefully, the link will work soon, so I can do this. I really want to tie a cs project into my weather and climate unit.
-
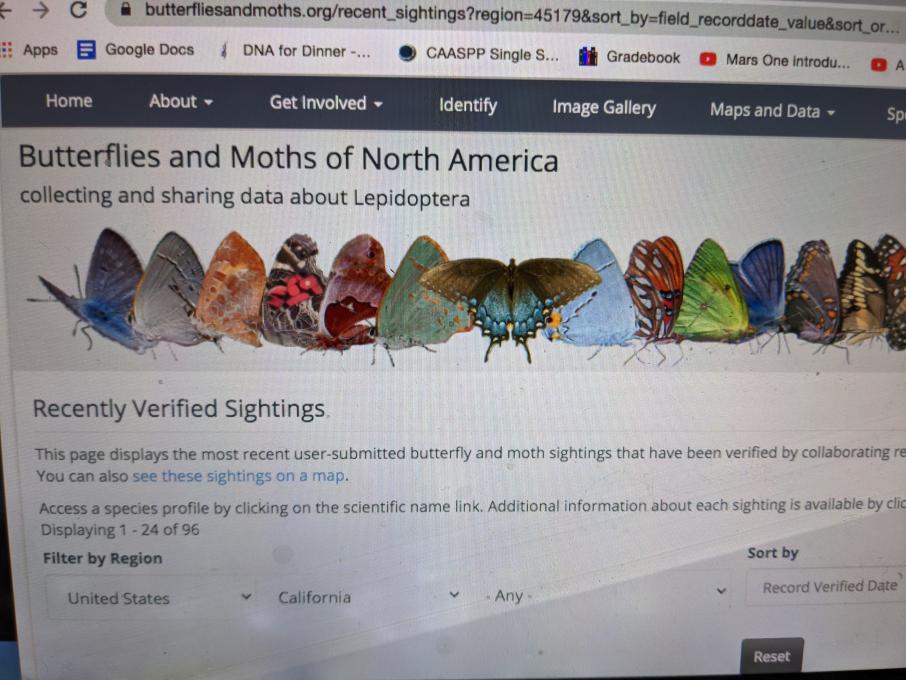
I researched Butterflies and Moths of North America, BOMONA, hosted by The Butterfly and Moth Network. It collects and provides access to data from Panama to Canada. It says that the quality of the data is provided by collaborating lepidopterists. In its words: "The BAMONA project aims to serve as a one-stop database of butterfly and moth data that scientists can use to form or to address research questions. While it is a collaborative effort between individuals with varying levels of knowledge and experience with Lepidoptera, contributors share a common goal of assembling high-quality data on butterfly and moth distribution."
You have to collect your own data and establish your own database or fill out a request form on the site to acquire information. So, no, someone who has not signed up or participated in acquiring information can't use the data. The information the students can access would be the types of butterflies and moths in their area and information about them - what to look for.
We do a field study and have a butterfly garden so we could create our own database and the students could use the site's identification expertise. -
I looked into CoCoRaHS for a citizen science project, as a 4-H educator we have strong ties to the agricultural industry. This year was an interesting one for our farmers, as New York was in a stage 2 drought and continues to be abnormally dry. Many of our older teens are interested in helping their parents to continue farming and weather is very important. I think that using CoCoRaHS, which is available for anyone to use their data would be a great way for youth to get involved in learning more about weather and the impacts it will have on their crops.
-
I explored NestWatch which is a Citizen Science (CS) project through the Cornell Lab. NestWatch is a nest monitoring project that allows participants to report data about bird nests throughout the county. The website is very informative, easy to use and has several educational resources. Participants can learn about birdhouses, nest and egg identification and much more. Anyone can create an account where participants can map and record nest observations. By monitoring nests, participants can collect data about birds nesting at schools or certain sites. Students can learn about birds that use birdhouses (nest boxes) and can properly place boxes at sites to monitor. The information tracks trends and the reproductive successes of birds through the country. NestWatch also hosts publications and research related to nest monitoring. NestWatch publishes an annual report that summarizes the data received. The report has regionally specific results. Students can analyze trends with the top species reported in their region.
The website is accessible to anyone to explore. There are no requirements to use the data in the annual report or access the research and learning resources.
There are many different ways that students can use NestWatch to conduct investigations. Students can look at trends in the reproductive successes of birds from their region and explore why some birds are successful and others are declining. This CS project is very exciting and has so many applications. Data can be used in conjunction with other CS projects like eBird and NestCams.
-
This will certainly be useful to me since we are putting up to 2 nesting boxes with cameras. Thank you!
-
Read More: