The Cornell Lab Bird Academy › Discussion Groups › Inspiring Investigations through Citizen Science › Data Literacy Through Citizen Science
-
Bird AcademyBird AcademyTake a few minutes to find a citizen-science project that will allow you to query the database. Answer the three questions in the discussion below.
- Which citizen-science project did your research? Provide a brief background.
- Is the database accessible to anyone? Could someone who has not participated in the project use the data? Can students access the information?
- How might your students use this citizen-science project data to conduct an investigation?
You must be enrolled in the course to reply to this topic. -
Since I am currently using this citizen-science project with my students, I chose to do more research on Project FeederWatch (Cornell Lab of Ornithology). As Jen shared in the video, this project allows citizens (and students) to monitor bird eating habits during winter months. An inspiring scientist can monitor how many birds, including what kind, come to their feeder and more. The Project FeederWatcher website allows anyone to access data regarding what has been reported in the past. For example, when clicking on the top 25 birds inputted for Ohio during last year's season, you can see that a Northern Cardinal was #1. Someone who had not participated in the project could easily use the data to support their own research. Students could have access to the to the information with adult or teacher supervision. There are numerous ways that my students could use this data to conduct their own investigation. For example, my students could use the "Bird Summaries By State" data to correlate the type of birds seen and how much or what type of seed is eaten.
 1st Grade School Garden & Feeders
 -
Which citizen-science project did your research? Provide a brief background. I looked at Project Budburst first but struggled with how to access long term data. I saw how you could look at 1 observation at a time, but not how you could link the data to see trend over time. I then switched to E-bird. E-bird is site where you collect information on birds using checklists to record bird sightings. The information is then shared to help with conservation. Is the database accessible to anyone? Could someone who has not participated in the project use the data? Can students access the information? The data is available for people to view. I had already had an account with them, so I don't know if you need to make an account to see the data. I have not participated in a project yet, but was still able to view the data. Students can access the information. My elementary students might get lost, though, since there are so many different things they can view. How might your students use this citizen-science project data to conduct an investigation? My students can use this information to help conduct an investigation on a specific bird. They can view areas in the world that has that species of birds and look at patterns.
-
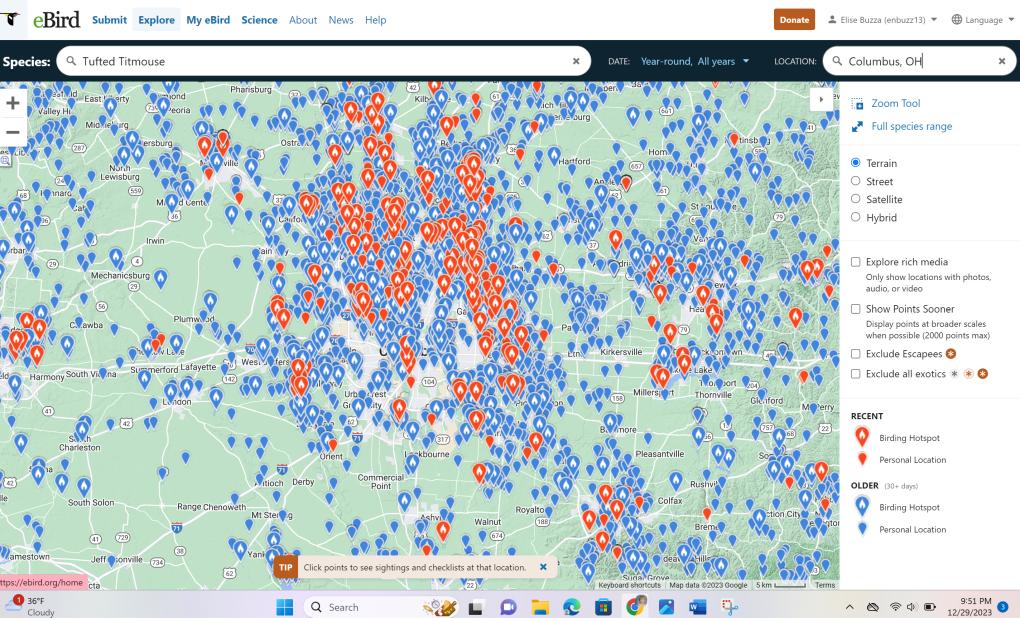
I researched eBird. This tracking system, allows any birder to input their bird data from their birding experiences. Scientists can then use the data submitted from average birders to understand migration, bird types, sounds, etc. Thus eBird directly playing a role in citizen science. This database is accessible to anyone and someone who has not participated in the project can use the data. For example, let's say a student is researching tufted titmouses and they want to know where the are primarily located. On ebird, the "species map" allows any individual to type in a bird type and the map shows where the bird type is directly located. (As seen in the screenshot image.) A student could then take their research project even further, and use the species map to locate what cities or areas the tufted titmouse is located more heavily in versus not. They could graph their findings and conduct further research on their prevalence in more areas than others. The second image shows in specified areas of the city of Columbus where the tufted titmouse was reported using ebird.
-
I queried the ebird database. It is accessible to anyone, and students can access it in a number of ways. I like how it shows many example of how the data can be used and I think that would be particularly helpful to go through with students as examples of types of investigations and help them develop their own questions. Investigations that could be developed are many, but one could be related to species migration by habitat and link it to the habitats near the school.
-
I researched a citizen-science project called Reef Check. This project does ecological surveys of the number and composition of marine species in different parts of the world's oceans. The data is available to anyone who requests it. Someone who has not participated in the program can access the data, including students. My students could use the project data to conduct an investigation about the health of the marine ecosystems over time or to determine how individual species of animals or algae populations are doing.
-
I accessed the Globe Program (https://datasearch.globe.gov/) database of climate data. The database is open to anyone (including students) and has data access and visualization tools. I queried the database for information about soil moisture in Massachusetts. We have taken soil samples near our school to better understand what makes soil "healthy" or "unhealthy" and one of our observations was that "healthy" soil has more moisture. I could see my students using this database to help understand many of the impacts of climate change in our state.
-
I use eBird every time I take my dog for a walk at our local park. I also use it frequently in the winter months when observing birds at my bird feeder. I think eBird will be a perfect project for my students to use since it is easy to navigate and downloads a species list that is common for the area being studied. Once they are comfortable using the app, I hope they will continue to use it outside of school. Not only can the students contribute data to eBird, but they can easily access the database for their region. I would like to incorporate the database into my lessons. For example, students can gather data on waterfowl that have been reported at Beaver Creek State Park in Northeast Ohio. They can use this data to determine when each species first arrives to help understand waterfowl migration. They can also monitor how there is an increase in waterfowl species diversity in early spring, but that the numbers will decrease as certain species move on to more northern regions to breed. I am excited to hopefully pique the interest of birding in my students and hope to develop their passion for observing the species in their community.
-
I searched the eBird site. If you have an account, you can add to the database. Data has been uploaded from all over the United States, and many countries. There is location, species, and date information included. I believe the data is available to anyone, but I had an account, but it was free. I have not participated in the collection of the data, only signed up for an account and I was able to access the data. I will have to investigate whether or not students are able to access the data. But in just a quick check, I was able to see all of the different birds in my county, and I could identify which ones are nonmigratory. Students could use this data to identify which birds might be found in our school yard at different times of the year.
-
I am looking at FeederWatch. The program is designed to have students do bird counts at their winter feeding areas. It was started in 2016 by the Cornell Lab of Ornithology. It is offered to Us & Canadian residents, for a cost of $18.00. Although, they did offer grants for this program earlier in the year for schools. Which we did sign up for! The database is accessible to anyone. There are no restrictions. Students can access the information. My students are going to use it to put more depth into their study of ornithology! It will give them a focal point, a reason to start "inquiry" questions! A desire to learn more once their interest is caught! We have feeders placed outside of the front of our classroom. Our classroom front is actually a series of sliding glass doors overlooking their gardens, a natural habit and the playground. So the students will be able to observe in all types of weather and conditions. From the Feeder Count we will see if they have any more inquiry questions and see where that takes us in the world of ornithology!
-
E-bird, because I've been collecting data for the last two years while visiting/living at my parents house. I do at least one checklist per day so I have a ton of data. Yes, as far as I am aware anyone has access to the data. They can use E-bird themselves to make an area at the school!
-
I looked at the eBird database that provided a graph of the number and species of birds observed from 1900 to present at a particular viewing location throughout the year. This database seems to be accessible to anyone as I have not viewed birds at this location and I was able to see all of the types of birds, and the best time of year to view them. I believe the students could use this database to help them determine what species of birds we would be viewing at the particular time of year we head out to record our bird sightings. Students could also use this database to answer several questions about migrations, migration paths and time of year for several species of birds.
-
I had never heard of the Lost Ladybug Project before and was curious to find what it's all about. We are losing our native ladybugs in North America, and the project aims to identify ladybugs and infer reasons why native ladybugs are becoming less common and how we can help restore their numbers. The database is easy to find on lostladybug.org in their LLP Data & Mapping tab. They have a variety of ways to view the data, including an exported list, summaries by species or county, and pie charts. Students might use this data to make connections about other observations about arthropods. By studying the habits of invasive species of ladybugs and how to identify them, we could better understand what's happening in a school garden, for example.
-
I like to look at the maps in Journey North. This has data publicly available that students can easily access. Journey North has recorded sightings on maps of frogs, various bird species, monarchs, leaf out times and tulip blooming--all signs of spring. The sightings have times associated with them. Students could overlay this data with temperature data, sunrise times, sunset times, distance from the ocean, proximity to rivers, etc. to see what variables may be affecting the time these various spring harbingers appear.
-
I researched eBird. EBird is a citizen science database, used nationwide to track location, species, and abundance of birds. This database is accessible to anyone, including students and people not participating in the project. There is so much data that students could use it in a multitude of ways to conduct information. They could look at abundance of certain bird species throughout different months of the year, track trends in sightings over multiple years, look at the time of year when certain species start to migrate, they can even compare numbers found between different regions, states, countries, or habitat types.
-
I started researching eMammal because I wasn't familiar with that, but I found the data difficult to download, so I need to do a little more research to figure out how to get to the data. So I went to eBird. eBird allows you to look at data for different species, or to look up data by region. You can easily compare sightings of different species over a year and see when they are most common. You can see who logged in the data and the date. Anyone can enter data with an account and it is accessible to anyone. It's very easy to get to the data and you do not have to be a participant to get the data. There are multiple ways students could use this data. You could look to see what birds are in your area. Students could compare the last date that a bird was seen during migration, and compare it to years past- to see if there are changes in last seen dates. They could also compare to other parts of the country, or other countries where the bird might live.
-
I looked at Birdata, BirdLife Australia's database. The database is accessible to anyone, and the data can be used by those that haven not participated. Students can access the information. Students could use the data to view bird observations in a particular place over time.
-
I choose iNaturalist which allows citizen scientists to log sightings of organisms. The database is accessible to anyone including students; so even if you haven't participated in the project you can use the data. The data is initially presented in graph form and shows sightings monthly for the current year and also data going back several years. Sex and life stage are also tracked. Students can click on points on the graph to show listings of the data. Students could compare data from multiple years to investigate questions like "Is there a shift in when songbirds are returning to Massachusetts in the springtime?".
-
I took some time to explore The Billion Oyster Project. The goal of this project is to return 1 billion oysters to the Hudson River by 2030. The Harbor School on Governor’s Island is running the program, and it is a great way to encourage citizen science in the metropolitan area. The database and data is available to anyone with an account, and, if you are in the area and would like to participate with your class, you can train as a citizen scientist and begin monitoring a station. Scientists continue to do work with the data, and they are publishing their results for people to examine and explore. I think the the most inviting piece of this project is that students will feel empowered by seeing high school students initiating such a bold goal and process. Students may become enthusiastic about participating in the program, and they may also begin considering an element of an eco-system near their own communities that might need to be replenished. The story of the oyster is fascinating. How can an organism whose function it is to clean and filter water be replaced after so many years, and how does it positively impact the environment surround it?
-
I am not currently teaching but when I do the database I will be using is Monarch Watch because there are schools in my community that have created Monarch butterfly projects already and the population of Monarch butterflies are quite large. The elementary projects already in progress have shared their data with the community already and I would like to perpetuate the counting further. If I had students they could choose a variety of factors to determine the effects on the monarch population. Factors such as the types of plants, the type of predators, the weather and various others factors.
-
iNaturalist will be used because it allows students to observe plants, animals, and insects. Group members can take each of the for-mentioned and more. Students will not only conduct observations but collect, report, and graph data.
-
I chose to research Project Budburst. This program allows students, teachers, classes, and families track plant and animal life cycles and help researchers better learn how humans affect the environment. The data is accessible to anyone who signs up for a free account. The data is easily accessible and looks like it is very relatable and understandable for all. Anyone can use the data for further exploration and personal projects, which is especially why I like this program. My students can use the data for their own investigation and research. My students can use the data to gain a better understanding of the natural world within their community. We are located in downtown San Francisco, where it can be hard to notice the environment with all of the traffic, people, noise, and buildings. Using the data from Project Budburst can first help my students understand what to look for before we go out and explore ourselves.
-
I chose to research eBird. I love that it is a free resource that anybody can use. If you just want to look at data you do not need to create an account. If you want to collect data you do need to make an account, but still free! Students could conduct many research questions using this site. For instance, if they really liked a rare bird, they could see how often it is seen in our area. Migration paths and times are always fun to research as well.
-
Our school started a monarch tagging program 3 years ago utilizing our prairie restoration garden. This was done through Monarch Watch. We started by initially counting how many monarch butterflies were seen over the course of a month, and how many milkweed plants we could count along with catapillars. This was so that we had a baseline, and led directly to collecting data on types of plants vs butterflies, moths, can caterpillars. We did have to ask the nighbors to quit collecting catapillars during our research. We sent the tag information along with counts to Monarch Watch. Currently the data has been shared with Monarch Watch, the local naturalists, a group that helps maintain a prairie near our school, the teacher garden comittee, admin, and different students as they go through the grades. This next year we are organizing to start investigating ways to support specific species of insect life. The data indicates that we are doing well with monarchs and admiral butterflies, as well as a wide ranger of bees and wasps. They have completed the initial research on proposed modifications in the garden to try and encourage rusty patch bumble bees and karner blue butterfly. Part of the investigation will involve the impact on other species. My hope is that the students will present to the school board and county commissioners next year as part of seeking funding.
-
Which citizen-science project did your research? Provide a brief background. eBird, a global citizen science project that gathers data about the quantity and distribution of bird species on Earth. Is the database accessible to anyone? Could someone who has not participated in the project use the data? Can students access the information? This database is accessible to everyone that has internet access. Even if you do not have an account you can use the data. Students can use the information without the need to create an account, it is easily accessible and user-friendly. How might your students use this citizen-science project data to conduct an investigation? It would help to answer a research-focused hypothesis. Perhaps to extend their knowledge of their local area to create a hypothesis. As well to compare species, regions and time.
 1st Grade School Garden & Feeders
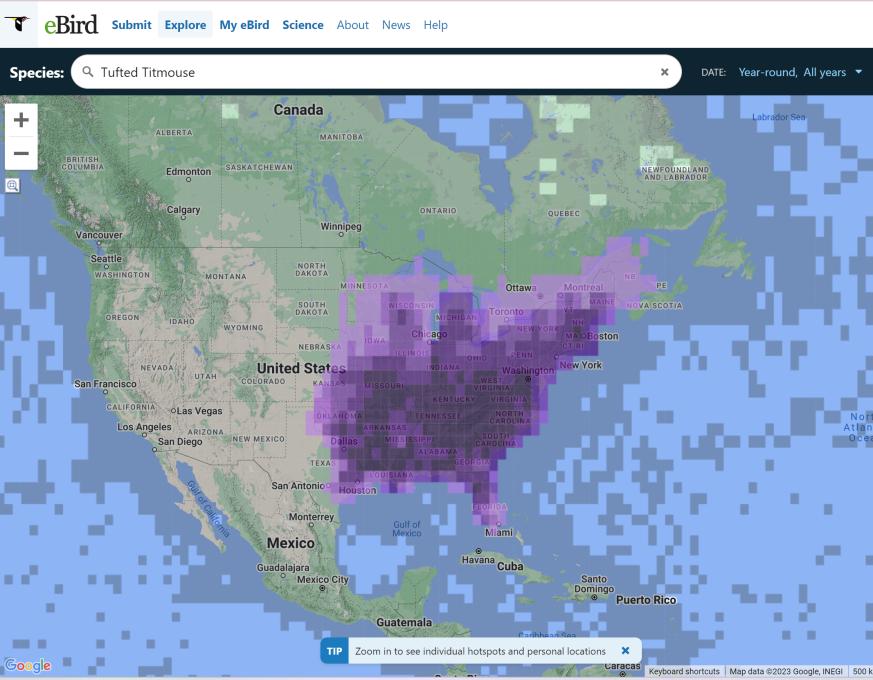
Read More: