The Cornell Lab Bird Academy › Discussion Groups › Inspiring Investigations through Citizen Science › Data Literacy Through Citizen Science
-
I explored Project Bud Burst. It provides activities for citizen science for individuals as well as simpler options for families.
The database is accessible to anyone- new participants are welcome and students can easily access information.
I liked the Phenology project described. I completed a workshop on climate change earlier in the summer and I would like to incorporate some of the concepts on global warming and climate change to assess their impact on the timing of falling leaves from silver maple trees in our schoolyard. This would involve multiple years of data collection to see the impact. -
I recently got involved with CoCoRahs which allows community scientists to measure precipitation in their own backyard, school grounds, or organization grounds. The database is easily accessible by anyone and you don't have to submit data in order to use the data. There are many ways this data can be used. One lesson plan I created recently involved students looking at rainfall data over the last 10 yrs for Tucson, AZ to determine the best month for land managers to spray pesticides on invasive bufflegrass, which can only be sprayed when it greens up. They would pull the rainfall data for the last 10 yrs and calculate the averages for each month of the year over the last 10 yrs to narrow down what month historically receives the most rainfall. Their data should lead them to choosing a month during the monsoon season (July-October).
-
I took a look at Journey North. We have been discussing a native plant garden at our school and thought that this might be something to incorporate. I was looking at the journey maps. By their description they engage "citizen scientists from across North America in tracking migration and seasonal change to foster scientific understanding, environmental awareness and the land ethic".
I was able to quickly access the maps that show the data, location and how the butterflies move. I think anyone would be able to look at the data and use it to make predictions. There are options to look at various years and make comparisons. Students would be able to start to draw questions about the patterns that they notice.
Students would be able to use this data to create a project and possibly help create and help plan our native plant garden or other projects. -
- I looked at Project BudBurst - data on plant phenology
- The database is accessible to anyone, including people who have not participated in the project and students.
- My students can use this data to investigate how the timing of key events in plant life have changed (or not) over the years, whether different plants are affected differently,....
-
Mission Monarch is the project I decided to look into. This project has participants locate and verify the presence of a milkweed plant. Next, participants identify the species and confirm whether or not there is the presence of monarchs. This is done through observations and examining the leaves for eggs, caterpillars or chrysalis. Next participants record their observations and the final step is submitting the data through the Mission Monarch website.
The data is available on their website but is not very well organized or easy to analyze. The data can be viewed on a map and with a list. The data has not been put into any graphs. This may make it difficult for younger children to look at and make sense of the information.
The data on the map could be used to determine the presence of monarch butterflies in certain areas and their abundance. The only thing I don't think this accounts for is the number of participants in the study. There may be a higher number of participants around the great lakes which makes it seems like there are more monarchs there but it could mean the organization got the word out about participation there but not on Long Island.
-
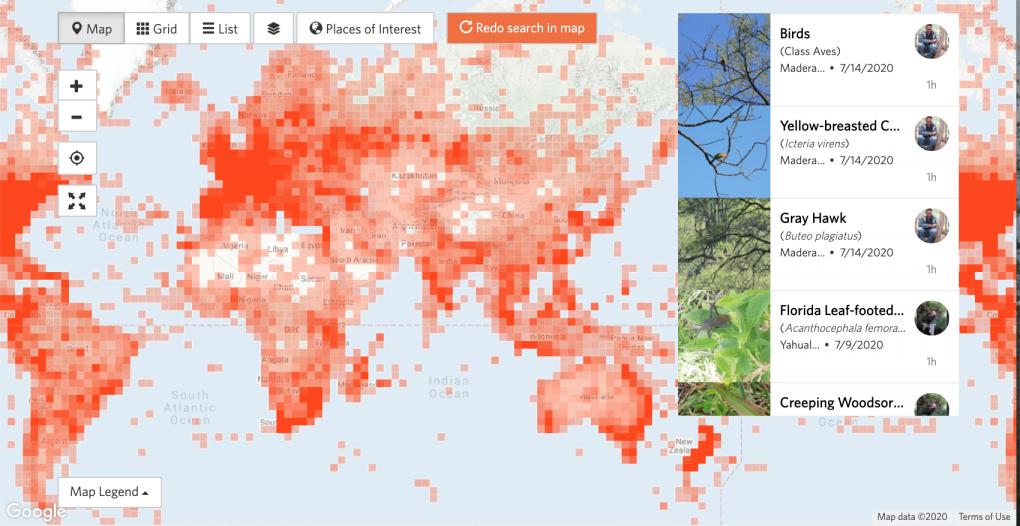
I spent some time looking througj SciStarter, as I wanted to explore other projects, but I didn't an option to sort by projects with datasets. Popped into a few projects but no obvious dataset to utilize so I chose iNaturalist. It's def my fav for a few reasons, mostly because this project has such a large scope - you can look at data from land to sky!
iNat is free and easily accessible if you create an account, though I believe you have to be 13yo to create your own account. Still, this tool would be easy for a family, or classroom, account so I don't think that age restriction is a huge deal.
Truly there are so many ways you could use iNat's huge dataset to conduct investigations:
- Range reduction/expansion: How are invasive species moving throughout your county, state, region? Combine that with weather data to investigate patterns
- Space use, preffered habitat: Determine preferred habitat type of X species - where are species located (ground, tree, etc) in observation photos?
-Temporal: Are migrating species spending more time in breeding/non-breeding locations?
-Exploring the concept of 0 in data collection: In your neighborhood, state, etc are we missing data and if so, why? -
https://www.cocorahs.org/
I've always been interested in weather observations and patterns, so I chose to look to CoCoRaHS, which is the Community Collaborative Rain, Hail, and Snow Network. I knew that citizen scientists can submit precipitation data, but it was interesting to see that we can also submit thunder data. Data is available to anyone through the website, by location and selectable time periods, through data tables and map data points. With only a rain gauge, it would be easy to check precipitation every day and graph that data on a line graph for comparison throughout the year. We could also submit the data through CoCoRaHS and compare data to other locations. Thunder reports are by morning, afternoon, evening, and night, so this would be simple tally mark data, and a great, simple data collection project to use as an introduction to citizen science. We could use this data to see what time of the year receives the most rain, and possibly if there is a time of the day when rain is more likely.-
Good to know! I could see using CoCoRaHS data to layer over species observation data to really emphasize the influence weather has on say - bird migration or the observation of artic species moving south in response to our warming earth (beluga whale sighting off San Diego).
-
-

I've used the iNaturalist database as it has so many species of wild organisms under one 'roof', and is a global database actively used in my region. It has become more popular due to the global City Nature Challenge (every April) and the knock-on Hong Kong Inter School City Nature Challenge (every November). With more than 44 million observations of almost 300,000 species (and counting!), it is an active database with great functionality to explore trends over seasons/time, categories of species, specific species, their threatened status and more, in their 'filter' search. Anyone, yes students too, can access the information that is shown spatially, with side tabs for additional observation data, but to download the data, you would need to sign-in (it's free). There is also a teacher's guide, video tutorials and more for further guidance, plus a forum for questions and discussions. Anyone can create a specific project (let's say if you are a teacher doing a lesson with a class) just for your biodiversity observation needs, and the observations made will be added to your project for easier analysis, but also to the overall iNaturalist database for all to see/use as well.
- investigations could include temporal trends and spatial patterns of particular species, or correlations between dependent species across trophic levels if studying food webs, etc.
- a fun thing to explore is the topic of "What's missing?" in various locations that have 'holes' in the data and consider why? These are often discussions that lead to factors about accessible research, human population density, technology, infrastructure, climate, etc., rather than the initial erroneous thought 'because nothing is there!'
- consider interdisciplinary investigations that use iNat data and layer it about human habitation patterns using GoogleMaps or OpenStreetMaps, or even Google Earth with 3D (if looking at bird sightings), or natural features like lakes, mountains, etc.
- eventually students can make recommendations about actions to be taken for species conservation or human development projects and engage with multiple stakeholders for tangible outcomes (e.g. discussions with district councillors, NGOs, etc.)
-
Looks amazing. I will explore this site. Thank you.
-
I am very interested in the City Nature Challenge and am excited about becoming a part of that with my students and families!
-
I chose the Budburst database. This database helps people identify the plants in their area. It has information about 300 different plant species. The information is accessible to anyone and is student friendly. You can search for plants by name, plant family/group, and state with out participating in the project. What is also great about this site is that they encourage observations of all plants even those not in their database. I could see students using this database to help identify neighborhood plants, trees, and shrubs in a plant study. The information in the database can give a wealth of information for numerous plant related activities.
-
I chose to research The Monarch Larva Monitoring Project (MLMP). I chose this project, because I thought it would interesting to look at the distribution of milkweed and the abundance of breeding monarchs. The data was very accessible and yes, I believe anyone could use this Citizen Science based data. The data was presented in a way I believe my 6th grade students could access and compare the data. The data was very comprehensive. Students could use and compare data from different states, different years and different times of the same year. Students could conduct their own investigation. They could pose a question using Estimating the Monarch Survival over the years, develop a hypothesis and then make some interesting conclusions. They could then use the data from Estimating the Monarch Survival to create their own graph to show any trends. There are so many ways to use this data; I believe its endless.
-
I researched emammel, https://emammal.si.edu/. This is a data management system and archive for camera trap research projects. You would need to have camera traps in order to participate in any of their projects. (I do know that some local museums will lend these to schools - we are lucky enough at our school to have a set of 4.)
This is a collection of camera trap projects and you are able to establish your own project for your school. I will say that the website took a while to understand and navigate. It would take time to figure out how to use this platform. I focussed in on NCSU Camera Trapping to look at their data. They have set up camera traps all over the local region in places such as greenways, golf courses, cemeteries and local parks. There was a variety of urban settings covered by 39 cameras. The data could be sorted by individual places (cameras were obviously moved as the project has been ongoing since 2015). The data was able to be manipulated into pie charts, bar graphs and tables. I like this as a table can be presented and students can then graph the data. There was also a way through emammal to view the actual photos from individual projects. I think students would need guidance to navigate into the individual projects but after mastering, they could easily research data. They would be able to focus on either a specific project, area, mammal and then add to the overarching research by creating their own project.-
Annette, Thanks for sharing. I think it is fabulous that your school has a set of 4 camera traps. This sounds like a very fun and exciting project. I wonder if my school could get some camera traps through some kind of funding or grant initiative? I will have to look into it. Thanks again for the great ideas.
-
-
I research Project Feederwatch. It is a Citizen Scientist project where people count birds in their backyard over the winter, from November - April. Participants are sent a research kit that includes a bird id calendar, but they have to supply the feeder and birdseed. It's used, as the video noted, to study winter bird abundance, and provides "information about bird population biology that cannot be detected by any other available method." Participants can see information such as historic maps, the top birds in their region, bird summaries, and trend graphs. I think this would be a fun winter project to practice bird identification and speculate about what might be causing changes in bird population over time, as well as away to explore the interconnectedness of life.
-
I researched the Monarch Larva Monitoring Project. This citizen science project monitors monarch population density and fosters monarch habitat and conservation. Participants in this study record the location, date, time frame, number of milkweed plants observed, and the number of eggs and larva on each plant.
The database is accessible, it's free, and is available without creating a login. Anyone can use this data and students would be able to access the information as well. Younger children would need assistance from an adult while older children would be able to search and utilize the data independently.
There are so many search features with this site. I tried accessing the data for Iowa. I selected the state, chose the year 2020, and specified a specific location in Ames (Ada Hayden). From there I could view all years 2011-2019 that data was collected from this site. They did not have 2020 data available yet. From there I could view a bar graph that measured Monarch density in that area. The data was collected every seven days. I was able to view how many eggs and larva were observed and could see the weeks that the density was higher than others.
We have a butterfly garden at our school with many milkweed plants. My students and I could participate in this citizen science project to learn about the monarch population around our school. We could then compare our data to areas surrounding our town in Iowa and even other states. -
I looked for a project that students could work with on their own outside of school. Project Budburst has projects that families can do on their own and did not seem to require a fee to use the site. Since a fee is not required, anyone would be able to use the site. I work with older high school students which should mean that they would not have difficulties navigating that site. As with all the sites that I have visited, there are messages and policies in place to protect visitors to that site that are younger than 13. There is a section to upload data. There is also an extensive database that is easily accessible with information about plants. The database on Project Budburst would be helpful to students in identifying plants they see in their natural surroundings.
-
Johanna, Thanks for the post. I think involving families it a terrific idea. The more the merrier and they can motivate each other! Nice job!
-
-
I researched project eMammal, it's described as a cyber-tool, a data management system and archive (at the Smithsonian) for camera trap research projects, it is a collection of projects under one roof so to speak.
The database is actually accessible to anyone, and you don't have to have participated in the project itself, which is nice, so yes, students could access the data/information, allows you sort by region which is also helpful. I chose a project within the database in Virginia, evaluating factors that promote colonization of developed areas by predators and the ecological implications of that.
I think students could certainly use this any of the projects data easily, some charts are available as well, there is a wealth of well organized information. I feel it could also spark local questions and thoughts for cz projects here.-
Thanks for sharing Elizabeth, good to know that you can access this dataset even if you don't operate your own. I'm defintely going to check it out!
-
-
The citizen-science project I researched was Monarch Watch. Monarch Watch is all about monarch conservation and education. They use tagging data, which are little stickers that anyone can use to place on monarchs, to track their migration which gives scientists an understanding of how their population is doing. As well, they encourage people to make "Monarch Waystations" by making milkweed seeds (monarch caterpillar's only food source) available to schools and non-profit educational centres for free. The data they have on their website is available to everyone without a login. The tagging recoveries of the monarch butterflies are presented in a spreadsheet format so you can see what the tag number was, where and when it was found (including the specific geographic coordinates), and the names and notes of the person who submitted the tagging data. Students can definitely access the data, even if they have not participated before. One way students can use the data to conduct an investigation is to compare monarch populations over the last several years to see if there is an overall trend in population increase or decrease. Students can also compare where the monarchs are found, and determine if there is a trend in where most of the monarchs are being found. The data of this citizen-science project lends itself well to graphs.
-
Taylor,
This sounds like such a fun citizen science project that students would love! That's great that the data is available to anyone for free and that this organization provides milkweed plants to schools and non-profit organizations. There seems to be so much information available. I think utilizing the spreadsheet to see where the monarch was found and additional notes from the person who submitted the tag would be interesting for students to see. You offered some great suggestions for ways that students could use this information. Determining trends where monarchs are found would be a great investigation for students. -
Thank you for sharing this project. I looked into https://www.mission-monarch.org/
It seems like project Monarch Watch is well established and provides a nice amount of data. I will spend more time looking into it. -
Taylor - thank you. This is a great resource. FYI - there is another site that includes Monarch Watch which is the Joint Monarch Venture JMV. This site is a clearinghouse of all monarch resources. JMV hosts monthly monarch webinars which are terrific. Students can learn a lot from the webinars. Webinars are appropriate for high school student. The JMV has resources and publications that would be useful to students as well. We monarchs are beloved by many different audiences.
-
-
I browsed through the citizen science site- Journey North. Data is collected from a large variety of species as well as documenting natural phenomena. The data base is open without a log in, but that is an option as well. The data is in tables, some entries include photos, and does not include a search bar for the table- no graphs.Links to species info,teaching tips and a plethora of articles, live web cams and videos for students makes this an interesting site.
I think students would enjoy is seeing the sightings data represented on a map of the USA but I do miss the charts and a clearer interpretation of the submitted data. I think as for a student investigation, questions could be proposed and information gleaned from the "Facts" section under any particular species. Also the tables do give the state,city name as well as latitude and longitude. I think older students could scan the data tables for trends, and create their own charts, on a variety of interests at Journey North.-
Journey North sounds interesting in that it documents natural phenomena & has links to species info & live cams. I would think the live cams could be a great tool to introduce species behaving naturally in their habitat, hadn't thought of that approach. Good find!
-
-
I chose the Lost Ladybug Project. The goal of this project is to figure out the species distribution across the world for ladybugs so other insect populations can be kept in check. I tried to do a data export of the LLP data but it didn't appear to work. However, summaries were available by species and country and you could also graph data using a pie chart. For lower level grade, this data would be ideal. There were also maps of the United States that showed drop points for 4 different species. Students could use this data to try to figure out habitat requirements of different species, they could make a pie charts, and they could also conduct bar graphs showing the summary of different species as well as a summary of country presence.
-
This would be fun! I love ladybugs and this would work for lower and upper level students.
-
You have reminded me of another topic that might have a more finite length of time of observing ladybugs, (the fall). I am going to look into this and think about how I can find a teacher with whom to work to collect data on ladybug species.
-
-
I researched Project BudBurst. It collects data regarding phenology of plants. You record the date, location, plant, and the phenophase that the plant is in. The database is accessible to anyone; you don't have to participate in the project to use the data. I did create a login and password. I'm not sure if you can access the data without it.
Students can compare the date of the phenophase of a type of plant over several years to see if the timing of flowering is changing over time.
Read More: